Synthetic Population Generation of United States for Reinforcement Learning
Abstract: There are many uses for synthetic populations. Modern applications utilize high performance computing in stochastic simulations to research areas, such as, disease spread, information spread, economics, social modeling, disaster response, catastrophic events, collective behaviors, public policies, graph neural networks, computational social science and many more. In this paper I develop a python software package to generate a synthetic population from public datasets.
- Update 2022:
- Introduction
- 2019 Census Data Processing
- Grab all files from data directory, (Path windows/linux agnostic)
- Ingest Census CSV Data and Metadata Files with Pandas
- Drop all the columns for marginal error, and other unneeded columns
- Now current_meta_df drops all MarginOfError data
- Rename current_data_df Columns
- Generate Simplified Meta CSV File
- Methods: PopulationGenerator Package
- Results: Sample the Census Distribution using PopulationGenerator Class
- 2019 PUMA Data Processing
- USA Total Population, Compare 1 Year PUMs, 5 Year PUMs and the 2019 Census
- Conclusion
from poppygen import PopulationGenerator
from poppygen.datasets import process_acs, process_safegraph_poi, process_pums

poi_df = process_safegraph_poi()
acs_df = process_acs()

pg = PopulationGenerator(poi_df, acs_df)

local_population = pg.generate_population(population_size=100, census_block_group=[120330001001, 120330036071])
print(local_population[0].baseline)

pg.generate_activity(population=local_population)
print(local_population[0].activity["location"])
Introduction
There are many uses for synthetic populations. Modern applications utilize high performance computing in stochastic simulations to research areas, such as:
- Disease spread
- Information spread
- Economics
- Social modeling
- Disaster response
- Catastrophic events
- Collective behaviors
- Public policies
- Graph neural networks
- Computational social science
- and many more.
Developing this synthetic population involves two demographic datasets, the 2019 US Public Use Microdata Sample (PUMS) and the 2019 US Census.
The Census is a survey based sampling of the population, however this is a marginal distribution of data records that do not account for the correlations among variables, such as, household income and education level.
The PUMS is a 1-Year and 5-Year dataset from the Census Bureau, that samples 1% of the population each year. This will be used to estimate a joint distribution of age, gender and race.
First I will walk through some preprocessing of the census data, then I will build a PopulationGenerator that will take in the size of the population one wishes to generate and the Census Block Groups (CBG) for which to sample the data from. The PopulationGenerator will use a Person class that has demographics for each sampled individual of the population.

%config InlineBackend.figure_format = 'retina'
import jdc
import sys
import os
import pandas as pd
import numpy as np
print(sys.version)

#set random seed to have reproducable random states
random_seed = 42

#set pandas option to view more columns
pd.set_option('display.max_columns', 500)
pd.set_option('display.width', 10000)

!where python
!python --version
!pip --version
!conda --version
#!pip list
#!conda list
#!python -m pip install --upgrade pip #if you need to upgrade pip

## VERSION OUTPUT BELOW ##
#Python 3.9.4
#pip 21.2.4 (python 3.9)
#conda 4.10.3
# Build Paths to Data (windows/linux agnostic)
from pathlib import Path

datadir = Path("data/2021-10-04-usa-synthetic-population/data/safegraph/\
safegraph_open_census_data_2019/data/")

meta_datadir = Path("data/2021-10-04-usa-synthetic-population/data/\
safegraph/safegraph_open_census_data_2019/metadata/")

data_outdir = Path("data/2021-10-04-usa-synthetic-population/data/out/")
geo_datadir = None
pattern_datadir = None

# Get data files, platform dependent ls
pums_5_year_2019_person_file = Path("data/2021-10-04-usa-synthetic-population/\
data/pums/5-year/csv_pfl/psam_p12.csv")

census_tract_to_puma_file = Path("data/2021-10-04-usa-synthetic-population/\
data/pums/2010_Census_Tract_to_2010_PUMA.csv")

display(sys.platform)
if sys.platform == 'win32':
    data_files = os.listdir(datadir)
    meta_files = os.listdir(meta_datadir)
    display(data_files)
    display(meta_files)
else:
    # Return list of files in alphanumeric order
    data_files = list(os.popen(f"ls {datadir}"))
    data_files = [file.strip("\n") for file in data_files]
    meta_files = list(os.popen(f"ls {meta_datadir}"))
    meta_files = [file.strip("\n") for file in meta_files]
    display(data_files)
dict_df = dict()
dict_df[data_files[0]] = pd.read_csv(datadir / data_files[0]) #chunksize=chunk_size)
current_data_df = dict_df[data_files[0]]

print("2019 Census Dataset")
display(current_data_df)

#ls should return files in alphabetic order, but just an extra layer of certainty use this loop to get the description file
dict_meta_df = dict()
for i,f in enumerate(meta_files):
    if(f == "cbg_field_descriptions.csv"):
        dict_meta_df[meta_files[i]] = pd.read_csv(meta_datadir / meta_files[i]) #chunksize=chunk_size)
        current_meta_df = dict_meta_df[meta_files[0]]
        print("2019 Census Metadata")
        display(current_meta_df)
        break
drop_marginoferror_df = current_meta_df[current_meta_df["field_level_1"] == "MarginOfError"]
drop_marginoferror_ls = list(drop_marginoferror_df["table_id"])
keep_meta_df = current_meta_df[current_meta_df["field_level_1"] != "MarginOfError"]

# Drop margin of error, axis=1 drop columns, axis=0 drop rows, axis=0 is default mode
# alternatively, axis='rows' or axis'columns' is the same as axis=0 or axis=1, respectively
thisFilter = current_data_df.filter(drop_marginoferror_ls)
display(thisFilter)
current_data_df.drop(thisFilter, inplace=True, axis=1)

display(current_data_df)
display(current_meta_df)

# Display this to see unique fields in the meta file
unique_meta_df = current_meta_df.apply(lambda col: col.unique())
current_meta_df = keep_meta_df
display(current_meta_df)
tmp_df = current_meta_df[current_meta_df.table_id.isin(list(current_data_df.columns))].copy()
tmp_missing_df = current_meta_df[~current_meta_df.table_id.isin(list(current_data_df.columns))]
tmp_df.fillna('', inplace=True)
t = tmp_df[["field_level_2", "field_level_3", "field_level_4", "field_level_5", "field_level_6"]]
newlabels_list = list(t["field_level_2"] + " " + t["field_level_3"] + " " + t["field_level_4"] + " " + t["field_level_5"] + " " + t["field_level_6"])

newlabels_list = [x.strip() for x in newlabels_list]
newlabels_list = [x.strip('"') for x in newlabels_list]
newlabels_list = [x.replace(',',"") for x in newlabels_list]
newlabels_list = [x.replace(")","") for x in newlabels_list]
newlabels_list = [x.replace("(","") for x in newlabels_list]
newlabels_list = [x.replace(" ","_") for x in newlabels_list]
tmp_list = list(tmp_df.table_id)
newlabels_dict = dict(zip(tmp_list, newlabels_list))

cell_ran = False
if cell_ran is False:
    cell_ran = True
    current_data_df.rename(columns=newlabels_dict, inplace=True)

current_data_df
Generate Simplified Meta CSV File
Having high quality metadata is paramount, it helps one understand the dataset. Here it was best to to derive my own metadata files from the Census metadata, as the census metadata was rather dense. This simple-meta-all-labels.csv allows me to quickly parse over the variables I'm most interested with my eyes. I map the table_id to B0xxxxx values and write to simple-meta-all-labels.csv CSV file.
simple_meta_df = pd.DataFrame(current_meta_df.table_id.copy())
tmp_df = current_meta_df.fillna('')

all_labels_list = list(tmp_df.field_level_2 + " " + tmp_df.field_level_3 + " " + tmp_df.field_level_4 + " " + tmp_df.field_level_5 + " " + tmp_df.field_level_6 + " " + tmp_df.field_level_7 + " " + tmp_df.field_level_8 + " " + tmp_df.field_level_9 + " " + tmp_df.field_level_10)
all_labels_list = [x.strip() for x in all_labels_list]
all_labels_list = [x.strip('"') for x in all_labels_list]
all_labels_list = [x.replace(',',"") for x in all_labels_list]
all_labels_list = [x.replace(")","") for x in all_labels_list]
all_labels_list = [x.replace("(","") for x in all_labels_list]
all_labels_list = [x.replace(" ","_") for x in all_labels_list]

simple_meta_df.insert(loc=1, column='simple_meta', value=all_labels_list)
simple_meta_df.sort_values("table_id", inplace=True)
simple_meta_df.to_csv(data_outdir / "simple-meta-all-labels.csv", index=False)
Methods: PopulationGenerator Package
PopulationGenerator Class
The PopulationGenerator samples from the census data for a given population size and census block group, taken as arguments to the instantiated class.
The Population Generator uses a multinomial distribution for sampling and instantiates a Person for each individual generated in the the population.
from scipy.stats import multinomial

class PopulationGenerator():
    """
    A population generator class based on census distribution data

    Parameters:
        census_block_group (list-like) optional: 1 or more census block groups in a list, can be exact cbg or parital to match all 'like'
        year (int): 4 digit integer year

    Returns:
        PopulationGenerator Object: Returning value
    """

    def __init__(self, census_block_group=None, year=0000, like=False):
        self.census_block_group = census_block_group
        self.year = year
        #TODO: house df of interest here?
        # self.current_data_df
        # self.current_meta_df
        self.gender_age_df = pd.DataFrame()
        self.gender_age_labels = list()
        self._count = -1


    @property
    def count(self):
        """Getter Method"""
        self._count += 1
        return self._count

    # @count.setter
    # def count(self):
    #     self._count =

    def selectData(self):
        pass

    def cleanData(self):
        pass


    def getGenderAge(self, census_block_group=None):
        #get only gender and age
        gender_age_df = current_data_df.filter(like="SEX_BY_AGE")
        #print(gender_age_df)


        #get labels for data
        gender_age_labels = list(gender_age_df.columns)


        #add census_block_group to labels so we can filter the df and use census_block_group as index
        gender_age_labels.insert(0, "census_block_group")
        #display(gender_age_labels)


        #use census_block_group as index
        gender_age_df = current_data_df.filter(gender_age_labels)
        gender_age_df.set_index("census_block_group", inplace=True)
        #display(gender_age_df)


        #make labels a one-to-one map to label gender_age_probList
        remove_labels = ["census_block_group","SEX_BY_AGE_Total_population_Total_Male", "SEX_BY_AGE_Total_population_Total_Female", "SEX_BY_AGE_Total_population_Total"]
        for d in remove_labels:
            gender_age_labels.remove(d)
        #display(gender_age_labels)


        #build probility list for multinomial distribution
        gender_age_probList = list()
        for x in gender_age_labels:
            #print(x)
            gender_age_probList.append(gender_age_df.at[census_block_group, x]/gender_age_df.SEX_BY_AGE_Total_population_Total.at[census_block_group])

        #must be same length
        assert(len(gender_age_probList) == len(gender_age_labels))
        self.gender_age_df = gender_age_df
        self.gender_age_labels = gender_age_labels
        return gender_age_probList, gender_age_labels

    def generatePopulation(self, population_size, census_block_group=None, like=False):
        """
        Generators population based on params

        Parameters:
            population_size (int): population size of each census_block_group in list
            census_block_group (list-like) optional: census block groups, overide class self.census_block_group

        Returns:
            population (list): Returns a list of Persons() generated
        """
        population = list()

        if like is True:
            #create a list... from 'like' first numbers in census_block_group in gender_age_df... scoop for gender_age_df is in other function
            pass
        if census_block_group is None and self.census_block_group is None:
            print("Please Provide census_block_group Param")
        elif census_block_group is None:
            cbg = self.census_block_group
        else:
            cbg = census_block_group

        for c in cbg:
            gender_age_probList, gender_age_labels = self.getGenderAge(census_block_group=c)
            rv_gender_age = multinomial.rvs(population_size, gender_age_probList)
            print(f'\n[i] Generated Population:\n{rv_gender_age}\n[i] Labels:\n{gender_age_labels}\n[i] Block Group:\n{c}\n[i] Probibility List:\n{gender_age_probList}\n[i] Population Size:\n{population_size}\n')
            for i,x in enumerate(rv_gender_age):
                [population.append(Person(gender_age=gender_age_labels[i], census_block_group=c, uuid=self.count)) for _ in range(x)]

            #assert(len(population) == population_size)
        print(len(population))
        return population
class Person():
    """
    A basic person class to hold census distribution data
    """

    def __init__(self, uuid, gender_age=None, race=None, height=None, weight=None, census_block_group=None):
        self.baseline = { #sampleFromJointDistribution() https://data.census.gov/cedsci/table?q=United%20States&tid=ACSDP1Y2019.DP05
            'gender_age': gender_age,
            'race': race,
            'height': height, #meters
            'weight': weight, #kg
            'census_block_group' : census_block_group,
            'uuid' : uuid
        }
        self.activity = {}
        self.location = {}
        self.exposure = {}
        self.mobility = {}

        #Reinforcement Learning Parameters
        self.state = None
        self.observation = None
Results: Sample the Census Distribution using PopulationGenerator Class
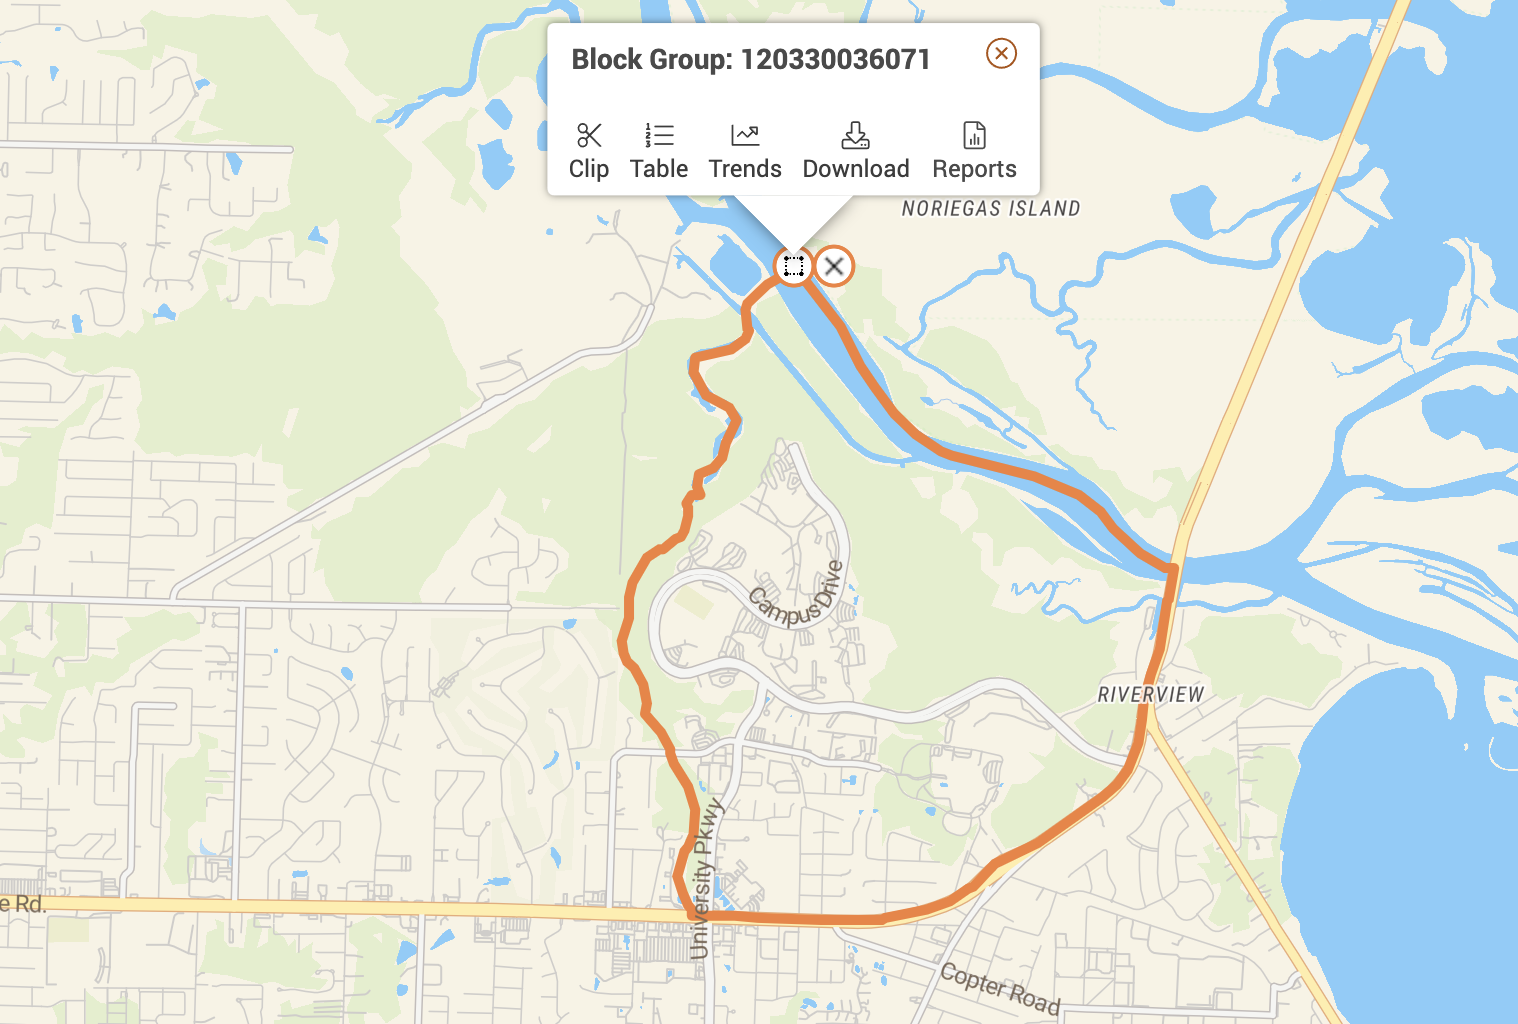
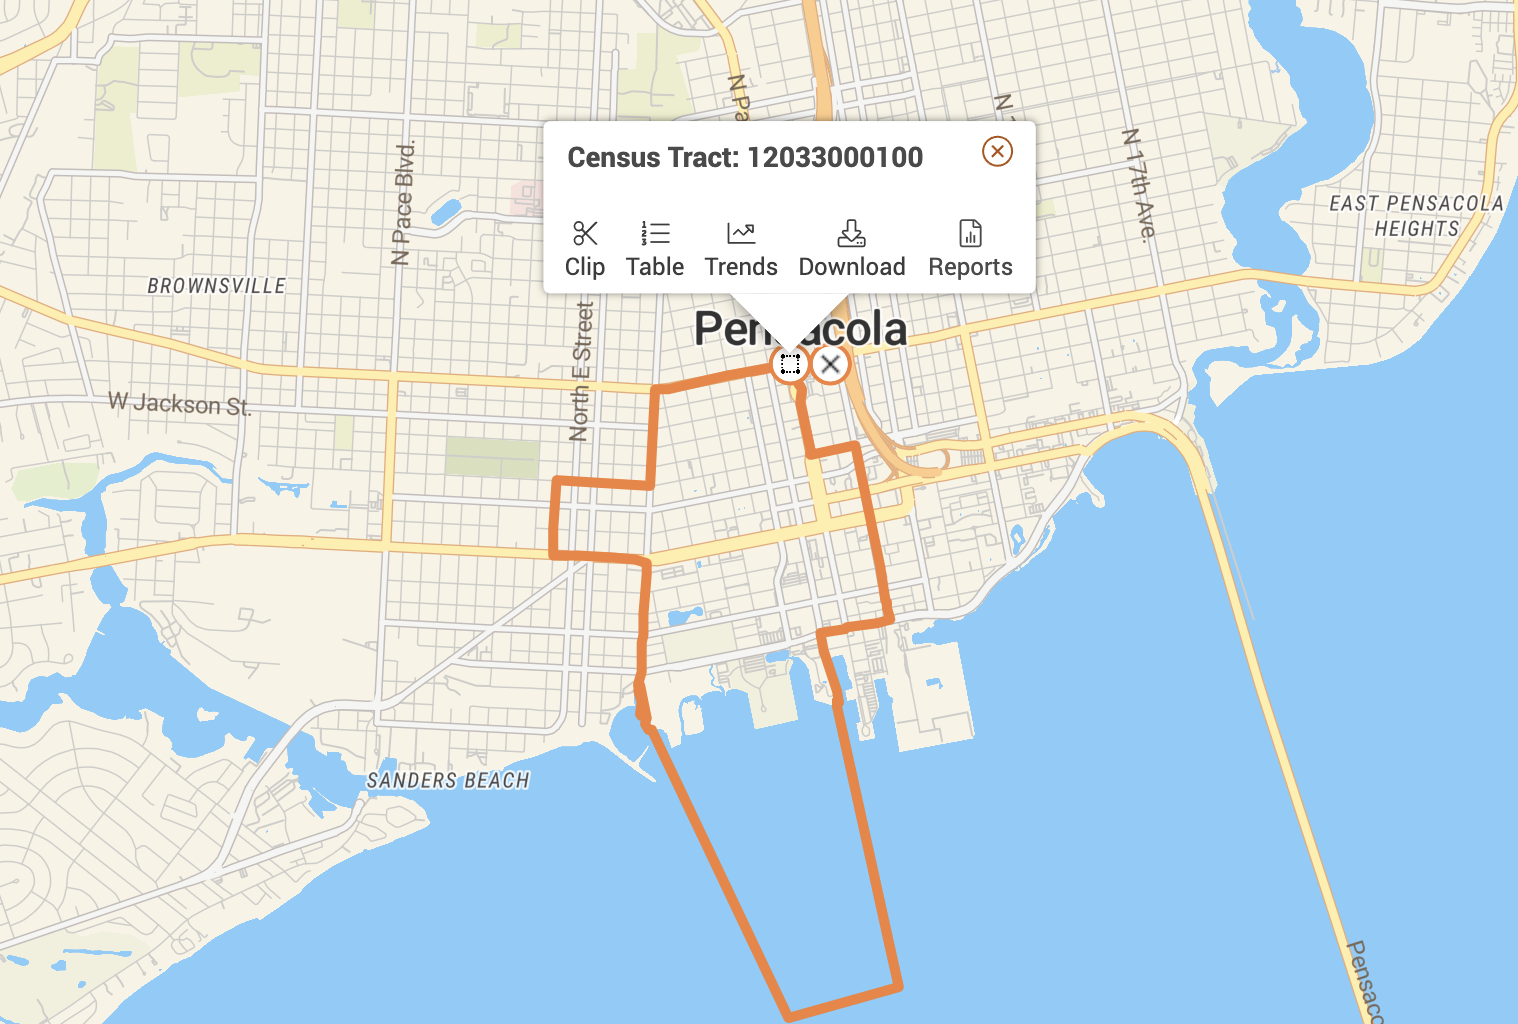
This function will return a population of 100 individuals from two census block groups in Pensacola, Florida. Census Block Group 120330036071 is the University of West Florida Campus in Pensacola and Census Block Group 12033000100 is Downtown Pensacola.
Census Block Group 120330036071, University of West Florida

Census Block Group 12033000100, Downtown Pensacola

PopulationGenerator Usage
Here you can see the instantiation of the PopulationGenerator as pg which calls the generatePopulation method that takes in a population size and a list of census block groups, the population is returned to local_population.
The output shows the generated population of the census block group used, the associated gender age labels for the population. The output also shows the block group used, as well as the probabilities associated with each gender age joint distribution group.
Finally, the output shows the resulting gender age attributes of person zero in the population.
pg = PopulationGenerator()

local_population = pg.generatePopulation(population_size=100, census_block_group=[120330001001, 120330036071])
local_population[0].baseline
import seaborn as sns
import matplotlib.pyplot as plt


#set style
sns.set_theme(style="darkgrid", palette="twilight_shifted_r")
sns.set(rc={"figure.figsize": (12, 8)})

#plot histogram data
tmp_df = pg.gender_age_df.drop(columns=["SEX_BY_AGE_Total_population_Total_Male", "SEX_BY_AGE_Total_population_Total_Female", "SEX_BY_AGE_Total_population_Total"])

tmp_male_df = tmp_df.iloc[:, :23]
tmp_female_df = tmp_df.iloc[:,23:]
tmp_male_dfT = tmp_male_df.T
tmp_female_dfT = tmp_female_df.T
tmp_male_dfT_sum = pd.DataFrame(tmp_male_dfT.sum(axis=1))
tmp_female_dfT_sum = pd.DataFrame(tmp_female_dfT.sum(axis=1))
age_bins = [5, 9, 14, 17, 19, 20, 21, 24, 29, 34, 39, 44, 49, 54, 59, 61, 64, 66, 69, 74, 79, 84, 85]
tmp_male_dfT_sum['age'] = age_bins
tmp_female_dfT_sum['age'] = age_bins
tmp_male_dfT_sum.rename(columns={0:'count'}, inplace=True)
tmp_female_dfT_sum.rename(columns={0:'count'}, inplace=True)
#display(tmp_male_dfT_sum)
#display(tmp_female_dfT_sum)

fig, (axm, axf) = plt.subplots(1, 2)
fig.suptitle('US 2019 Gender Age Histogram')

#Plot histogram for Male
sns.histplot(ax=axm, x=age_bins, weights=list(tmp_male_dfT_sum["count"]), bins=age_bins, kde=True)
axm.set(xlabel='Age Bins', title='Male Population by Age')

#Plot histogram for Females
sns.histplot(ax=axf, x=age_bins, weights=list(tmp_female_dfT_sum["count"]), bins=age_bins, kde=True)
axf.set(xlabel='Age Bins', title='Female Population by Age')
In the above plot one can see the gender and age distribution across the United States as recorded by the 2019 Census, it has a mixture of distributions with drop offs in the 20-30 range and great that age 60 range. This drop off in in the 20-30 age range may be explained by lack of participation in the Census Survey rather than actual population decline.
2019 PUMA Data Processing
Now that the Census data has been incorporated into the PopulationGenerator and tested, we can add in another dataset. The Public Use Microdata Sample (PUMS) is a 1-Year and 5-Year dataset from the Census Bureau's, this will be used to estimate a joint distribution of age, gender and race.
Ingest Census Tract to PUMA Mapping Files
In order to correlate the data from the PUMS dataset and the Census data, we need to map the locations of each defined geographic location as the PUMS and the Census use different definitions for location. The PUMS are relatively large land masses called PUMA of ~100,000 people, where as the Census Block Groups are on the order of 100s or 1000s of people. This makes a PUMA contain many Census Block Groups.
- census tract code is 11 digits, appending last digit identifies a unique census block group (cbg)
- all cbg that is part of a census tract (ct) is also part of the associated puma
- puma are relatively large landmass areas compared to tracts and cbg, no less than 100,000 people
#keep leading zeros in csv, later strip for STATEFP
dtype_dic = {'STATEFP' : str,
             'COUNTYFP' : str,
             'TRACTCE' : str,
             'PUMA5CE' : str}

#read in puma ct map file with dtype str
ct_puma_df = pd.read_csv(census_tract_to_puma_file, dtype=dtype_dic) #, index_col='STATEFP')

# strip leading zero for 'STATEFP' and 'full_fips_ct to match census_block_group in census csv coding
ct_puma_df.STATEFP = ct_puma_df.STATEFP.str.lstrip('0')
florida_state_fips_code = "12"
pensacola_metro_df = ct_puma_df[((ct_puma_df["PUMA5CE"] == "03301") | (ct_puma_df["PUMA5CE"] == "03302")) & (ct_puma_df.STATEFP == "12")].copy() #make .copy() to squalsh view warning messages
pensacola_metro_df["full_fips_ct"] = pensacola_metro_df.STATEFP + pensacola_metro_df.COUNTYFP + pensacola_metro_df.TRACTCE
pensacola_metro_df.to_csv(data_outdir / "pensacola-metro-area-2010-census-tract-to-2010-puma.csv", index=False)


#get a list of census tracts from pensacola metro area
full_fips_ct_list = list(pensacola_metro_df.full_fips_ct)

tmp_pg_df = pg.gender_age_df
tmp_pg_df['census_block_group'] = pg.gender_age_df.index
tmp_pg_df['census_block_group'] = tmp_pg_df.census_block_group.astype("string") #convert column to "string" not str...

found_pcola_cbg_df = pd.DataFrame()
found_pcola_cbg_df = pd.concat([tmp_pg_df[tmp_pg_df.census_block_group.str.contains(ct)] for ct in full_fips_ct_list])

print("All Census Block Groups that make up Escambia County")
display(found_pcola_cbg_df)
In the above output one can see all Census Block Groups that make up Escambia County, which map directly to the 2 PUMA areas in Escambia County.
print(f'Population of Pensacola Metro per Census 2019: {found_pcola_cbg_df.SEX_BY_AGE_Total_population_Total.sum()}')
USA Total Population, Compare 1 Year PUMs, 5 Year PUMs and the 2019 Census
After mapping all Pensacola Metro cbg to the puma. A quick total population summation is as follows:
Total US Population: 1-year pums, psam_p12.csv, PUMA 3301 and 3302 Weighted Population (PWGTP) is
Total US Population: 5-year pums total population:
Total US Population: 2019 Census
One can see the total population of Escambia County across three datasets is relatively the same, this serves as a good sanity check when cross-validating data and data processing.
Conclusion
As a result of this work, one can utilize the PopulationGenerator class generate a statistically accurate population of gender and age by location. The demographic data used to generate the population in the 2019 Census and the 2019 5-Year PUMS datasets. More attributes and demographics will be add to the Person class such as, race, mobility data and reinforcement learning parameters.